Technical Analysis
The STOCKGRAPH command is used for technical
analysis of stock market prices.
The "Wall Street City" data base was used to obtain price history for
S&P Depository Receipts identified by the trading symbol SPY. The data set
(filename: SPY.txt)
contains data on the open, high, low, and close daily prices
as well as the volume (number of shares traded)
for the period Mar. 3, 1999 to Mar. 1, 2000.
The following SHAZAM commands generate some graphs that can be used for technical analysis.
SAMPLE 1 253 * The variable SPY is the daily closing price for the symbol SPY. READ (SPY.txt) DATE OPEN HI LOW SPY VOLUME TIMEFMT %Y%m%d AXISFMT %m/%d * Set sample period from 1999/03/03 to 1999/12/31. SAMPLE 1 212 STOCK SPY VOLUME DATE / GRAPHVOL AXISFMT STOCK OPEN HI LOW SPY DATE / GRAPHMACD AXISFMT STOCK SPY DATE / EMA MASHORT=20 BOLL=2 LIST GRAPHDATA AXISFMT STOP |
The first STOCKGRAPH command generates the
chart below.
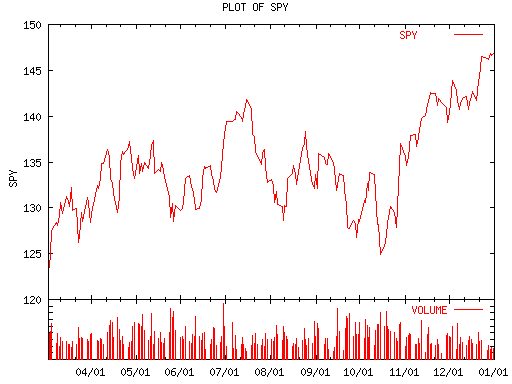
The above figure displays a volume bar chart at the bottom of the graph. The bottom of each volume bar is the value zero. The chart highlights the relative volume levels. The y-axis labels for the volume are not shown.
The second STOCKGRAPH command generates the next
chart.
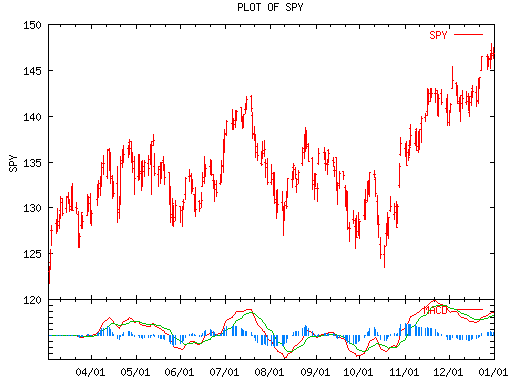
The above figure shows a daily bar chart where a vertical line marks the low and high values. The closing price is represented by a tick mark to the right of the bar and the opening value is given by a tick mark to the left of the bar.
The moving average convergence-divergence (MACD) line is the difference between a 26-day and 12-day exponential moving average. The "signal" or "trigger" line is calculated as a 9-day exponential moving average of this difference. The bottom of the above figure displays the MACD line (red color) and the signal line (green color). This chart also shows a bar chart (blue color) that represents the difference between the MACD and signal lines.
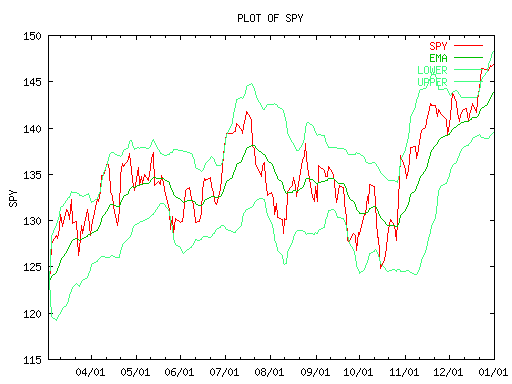
With the final STOCKGRAPH command
the EMA option gives the
calculation of an exponential moving average for the daily closing
price. The MASHORT= option is used to set the
number of time periods included in the moving average to n=20.
The weight for the exponential smoothing is set as:
w = 2/(n+1) = 2/(20+1) = 0.095
The exponential moving average is calculated as:
EMAt =
w closet + (1 - w) EMAt-1
On the graph below the series SPY and EMA are the daily closing prices and the exponential moving averages, respectively. The graph also shows the lower and upper Bollinger bands.
 [SHAZAM Guide home]