Measuring the Power of a Test
Suppose a sample of n observations is available from a normal population with mean µ and known variance. Consider testing the null hypothesis:
H0: µ = 5 against the 2-sided alternative
H1: µ
 5
5
The power of any test will depend on:
- the true population mean
- the sample size
- the significance level
- the population variance
The above ideas can be demonstrated with an example.
To compute a power function for the test a series of values for the
true population mean is generated. Values are set for the sample size,
the population standard deviation and the significance level.
The power is then calculated for each value of the mean.
The SHAZAM commands (filename:
POWER.SHA) that will do the
calculations are below.
* --------- SHAZAM procedure for computing the power of a test ------- PROC PFUNC * Test H0: mean = 5 versus H1: mean not equal to 5 * Input requirements * SDEV: standard deviation * NOBS: number of observations * ZVAL: the critical value GEN1 SD=[SDEV] GEN1 N=[NOBS] GEN1 ZCRIT=[ZVAL] * compute the upper and lower bounds of the acceptance region GEN1 STDERR=SD/SQRT(N) GEN1 XLOW=5-ZCRIT*STDERR GEN1 XUP=5+ZCRIT*STDERR * Try 20 different values of the population mean SAMPLE 1 20 GENR MEAN=5+TIME(-10)/100 * Find the probability of a Type II error GENR ZLOW=(XLOW-MEAN)/STDERR GENR ZUP=(XUP-MEAN)/STDERR GENR BETA=NCDF(ZUP)-NCDF(ZLOW) * Compute the power GENR POWER=1-BETA PROCEND * ------------------------------------------------------------------------- SAMPLE 1 20 * sd = 0.1; n=16 and alpha = 0.05 SDEV: 0.1 NOBS: 16 ZVAL: 1.96 EXEC PFUNC GENR POWER1=POWER * Increase the sample size * sd = 0.1; n=100 and alpha = 0.05 SDEV: 0.1 NOBS: 100 ZVAL: 1.96 EXEC PFUNC GENR POWER2=POWER * Decrease the significance level * sd = 0.1; n=16 and alpha = 0.01 SDEV: 0.1 NOBS: 16 ZVAL: 2.576 EXEC PFUNC GENR POWER3=POWER * Increase the variance * sd = 0.2; n=16 and alpha = 0.05 SDEV: 0.2 NOBS: 16 ZVAL: 1.96 EXEC PFUNC GENR POWER4=POWER * Print the results PRINT MEAN POWER1-POWER4 STOP |
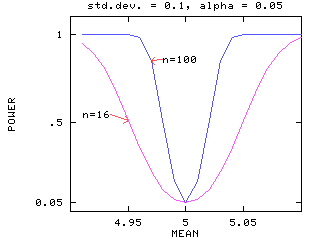
Figure 1 shows a graph of the power function for a sample size of n=16 and n=100. The population standard deviation is 0.1 and the significance level is 0.05. The figure illustrates that an increase in sample size leads to greater power. The figure also shows that the farther the true mean from the hypothesized value of 5 the greater the power of the test. When the true population mean is 5 the probability that we reject the null hypothesis is 0.05, the significance level of the test.
Figure 1

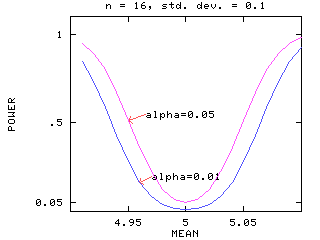
Figure 2 shows a graph of the power function for significance levels of 0.05 and 0.01. The sample size is n=16 and the population standard deviation is 0.1. The figure illustrates that a smaller significance level gives lower power.
Figure 2

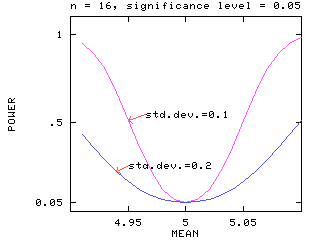
Figure 3 shows a graph of the power function for standard deviations of 0.1 and 0.2. The sample size is n=16 and the significance level is 0.05. The figure illustrates that a larger variance gives lower power.
Figure 3

 [SHAZAM Guide home]