Critical Values of the t Distribution
 |
The probability density function of the t-distribution
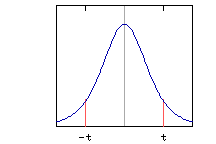
The t-distribution is a symmetric distribution and its shape depends on the degrees of freedom (df). The t-distribution has thicker tails than the normal distribution but, as the df increases, the t-distribution approximates the normal distribution. The area under the pdf to the right of t is equal to  /2. /2.
|
| d.f. |  = .10 = .10 |
 = .05 = .05 |
|---|---|---|
| 1 | 6.314 | 12.706 |
| 2 | 2.920 | 4.303 |
| 3 | 2.353 | 3.182 |
| 4 | 2.132 | 2.776 |
| 5 | 2.015 | 2.571 |
| 6 | 1.943 | 2.447 |
| 7 | 1.895 | 2.365 |
| 8 | 1.860 | 2.306 |
| 9 | 1.833 | 2.262 |
| 10 | 1.812 | 2.228 |
| 11 | 1.796 | 2.201 |
| 12 | 1.782 | 2.179 |
| 13 | 1.771 | 2.160 |
| 14 | 1.761 | 2.145 |
| 15 | 1.753 | 2.131 |
| 16 | 1.746 | 2.120 |
| 17 | 1.740 | 2.110 |
| 18 | 1.734 | 2.101 |
| 19 | 1.729 | 2.093 |
| 20 | 1.725 | 2.086 |
| 21 | 1.721 | 2.080 |
| 22 | 1.717 | 2.074 |
| 23 | 1.714 | 2.069 |
| 24 | 1.711 | 2.064 |
| 25 | 1.708 | 2.060 |
| 26 | 1.706 | 2.056 |
| 27 | 1.703 | 2.052 |
| 28 | 1.701 | 2.048 |
| 29 | 1.699 | 2.045 |
| 30 | 1.697 | 2.042 |
| 35 | 1.690 | 2.030 |
| 40 | 1.684 | 2.021 |
| 45 | 1.680 | 2.014 |
| 50 | 1.676 | 2.009 |
| 60 | 1.671 | 2.000 |
| 70 | 1.667 | 1.994 |
| 80 | 1.664 | 1.990 |
| 90 | 1.662 | 1.987 |
| 100 | 1.660 | 1.984 |
| 120 | 1.658 | 1.980 |
 |
1.645 | 1.960 |
Note: When the df exceeds 30 critical values are not tabulated for
every case.
For degrees of freedom that are not tabulated, the SHAZAM
CONFID command rounds up.
For example, with 31 degrees of freedom the critical value for 35 df
is used.
Some releases of SHAZAM use critical values that are less accurate for df > 30.
 [SHAZAM Guide home]