Portfolio Selection
The PORTFOLIO command
provides features for calculating efficient portfolios.
Example
Berndt [1991, Chapter 2] provides a data set of monthly returns
for a number of companies for the period January 1978 to December 1987.
From this data set, a file
(filename: P.txt)
was prepared with returns for
Mobil, IBM, Weyerhauser and Citicorp as well as the return on
30-day Treasury Bills (a measure of the risk-free return) and
a value-weighted composite monthly market return based on all stocks listed
at the New York and American Stock Exchanges.
The SHAZAM commands below solve a portfolio selection problem.
SAMPLE 1 120
READ (P.txt) DATE MOBIL IBM WEYER CITCRP MARKET RKFREE / SKIPLINES=1
* Convert to percentages
GENR MOBIL=100*MOBIL
GENR IBM=100*IBM
GENR WEYER=100*WEYER
GENR CITCRP=100*CITCRP
* Set a risk-free rate of return
GEN1 RF=100*(RKFREE:120)
PORTFOLIO MOBIL IBM WEYER CITCRP / INRATES RISKFREE=RF EQUALW PFRONT &
       GRAPHDATA GRAPHLINE
STOP
|
Below is SHAZAM output generated by the
PORTFOLIO command.
|
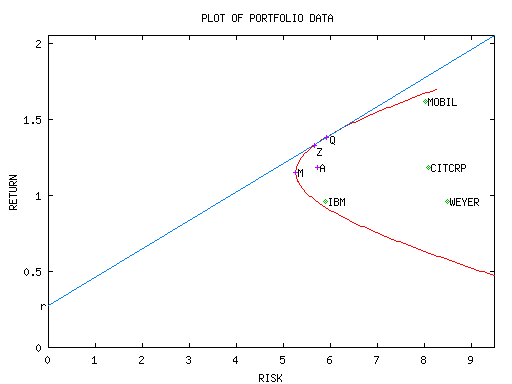
The figure below shows the minimum-variance risk-return frontier. The x-axis measures the standard deviation of return.

The portfolios marked M and Z are the
MINIMUMVARIANCE and RISKFREE=ZERO
portfolios respectively.
The curve that extends upward from point M gives the efficient frontier.
That is, all portfolios on the efficient frontier have greater expected
return than the portfolio with the global minimum variance.
The portfolio A is the equal-weighted portfolio calculated with the
EQUALWEIGHT option and reported on the SHAZAM output in
the ACTUAL column.
Clearly, this is not an efficient portfolio since it is possible
to find an alternative portfolio with the same risk but a higher
expected return.
The straight line with an intercept at the risk-free rate of return r that is tangential to the efficient frontier at point Q has a slope that is the maximimum Sharpe ratio of all possible portfolios.
 [SHAZAM Guide home]